One Shot One Kill ICT [TradingFinder] Liquidity MMXM + CISD OTE🔵 Introduction
The One Shot One Kill trading setup is one of the most advanced methods in the field of Smart Money Concept (SMC) and ICT. Designed with a focus on concepts such as Liquidity Hunt, Discount Market, and Premium Market, this strategy emphasizes precise Price Action analysis and market structure shifts. It enables traders to identify key entry and exit points using a structured Trading Model.
The core process of this setup begins with a Liquidity Hunt. Initially, the price targets areas like the Previous Day High and Previous Day Low to absorb liquidity. Once the Change in State of Delivery(CISD)is broken, the market structure shifts, signaling readiness for trade entry. At this stage, Fibonacci retracement levels are drawn, and the trader enters a position as the price retraces to the 0.618 Fibonacci level.
Part of the Smart Money approach, this setup combines liquidity analysis with technical tools, creating an opportunity for traders to enter high-accuracy trades. By following this setup, traders can identify critical market moves and capitalize on reversal points effectively.
Bullish :
Bearish :
🔵 How to Use
The One Shot One Kill setup is a structured and advanced trading strategy based on Liquidity Hunt, Fibonacci retracement, and market structure shifts (CISD). With a focus on precise Price Action analysis, this setup helps traders identify key market movements and plan optimal trade entries and exits. It operates in two scenarios: Bullish and Bearish, each with distinct steps.
🟣 Bullish One Shot One Kill
In the Bullish scenario, the process starts with the price moving toward the Previous Day Low, where liquidity is absorbed. At this stage, retail sellers are trapped as they enter short trades at lower levels. Following this, the market reverses upward and breaks the CISD, signaling a shift in market structure toward bullishness.
Once this shift is identified, traders draw Fibonacci levels from the lowest point to the highest point of the move. When the price retraces to the 0.618 Fibonacci level, conditions for a buy position are met. The target for this trade is typically the Previous Day High or other significant liquidity zones where major buyers are positioned, offering a high probability of price reversal.
🟣 Bearish One Shot One Kill
In the Bearish scenario, the price initially moves toward the Previous Day High to absorb liquidity. Retail buyers are trapped as they enter long trades near the highs. After the liquidity hunt, the market reverses downward, breaking the CISD, which signals a bearish shift in market structure. Following this confirmation, Fibonacci levels are drawn from the highest point to the lowest point of the move.
When the price retraces to the 0.618 Fibonacci level, a sell position is initiated. The target for this trade is usually the Previous Day Low or other key liquidity zones where major sellers are active.
This setup provides a precise and logical framework for traders to identify market movements and enter trades at critical reversal points.
🔵 Settings
🟣 CISD Logical settings
Bar Back Check : Determining the return of candles to identify the CISD level.
CISD Level Validity : CISD level validity period based on the number of candles.
🟣 LIQUIDITY Logical settings
Swing period : You can set the swing detection period.
Max Swing Back Method : It is in two modes "All" and "Custom". If it is in "All" mode, it will check all swings, and if it is in "Custom" mode, it will check the swings to the extent you determine.
Max Swing Back : You can set the number of swings that will go back for checking.
🟣 CISD Display settings
Displaying or not displaying swings and setting the color of labels and lines.
🟣 LIQUIDITY Display settings
Displaying or not displaying swings and setting the color of labels and lines.
🔵 Conclusion
The One Shot One Kill setup is one of the most effective and well-structured trading strategies for identifying and capitalizing on key market movements. By incorporating concepts such as Liquidity Hunt, CISD, and Fibonacci retracement, this setup allows traders to enter trades with high precision at optimal points.
The strategy emphasizes detailed Price Action analysis and the identification of Smart Money behavior, helping traders to execute successful trades against the general market trend.
With a focus on identifying liquidity in the Previous Day High and Low and aligning it with Fibonacci retracement levels, this setup provides a robust framework for entering both bullish and bearish trades.
The combination of liquidity analysis and Fibonacci retracement at the 0.618 level enables traders to minimize risk and exploit major market moves effectively.
Ultimately, success with the One Shot One Kill setup requires practice, patience, and strict adherence to its rules. By mastering its concepts and focusing on high-probability setups, traders can enhance their decision-making skills and build a sustainable and professional trading approach.
Cerca negli script per "the strat"

IU Trailing Stop Loss MethodsThe 'IU Trailing Stop Loss Methods' it's a risk management tool which allows users to apply 12 trailing stop-loss (SL) methods for risk management of their trades and gives live alerts when the trailing Stop loss has hit. Below is a detailed explanation of each input and the working of the Script.
Main Inputs:
- bar_time: Specifies the date from which the trade begins and entry price will be the open of the first candle.
- entry_type: Choose between 'Long' or 'Short' positions.
- trailing_method: Select the trailing stop-loss method. Options include ATR, Parabolic SAR, Supertrend, Point/Pip based, Percentage, EMA, Highest/Lowest, Standard Deviation, and multiple target-based methods.
- exit_after_close: If checked, exits the trade only after the candle closes.
Optional Inputs:
ATR Settings:
- atr_Length: Length for the ATR calculation.
- atr_factor: ATR multiplier for SL calculation.
Parabolic SAR Settings:
- start, increment, maximum: Parameters for the Parabolic SAR indicator.
Supertrend Settings:
- supertrend_Length, supertrend_factor: Length and factor for the Supertrend indicator.
Point/Pip Based:
- point_base: Set trailing SL in points/pips.
Percentage Based:
- percentage_base: Set SL as a percentage of entry price.
EMA Settings:
- ema_Length: Length for EMA calculation.
Standard Deviation Settings:
- std_Length, std_factor: Length and factor for standard deviation calculation.
Highest/Lowest Settings:
- highest_lowest_Length: Length for the highest/lowest SL calculation.
Target-Based Inputs:
- ATR, Point, Percentage, and Standard Deviation based target SL settings with customizable lengths and multipliers.
Entry Logic:
- Trades initiate based on the entry_type selected and the specified bar_time.
- If Long is selected, a long trade is initiated when the conditions match, and vice versa for Short.
Trailing Stop-Loss (SL) Methods Explained:
The strategy dynamically adjusts stop-loss based on the chosen method. Each method has its calculation logic:
- ATR: Stop-loss calculated using ATR multiplied by a user-defined factor.
- Parabolic SAR: Uses the Parabolic SAR indicator for trailing stop-loss.
- Supertrend: Utilizes the Supertrend indicator as the stop-loss line.
- Point/Pip Based: Fixed point-based stop-loss.
- Percentage Based: SL set as a percentage of entry price.
- EMA: SL based on the Exponential Moving Average.
- Highest/Lowest: Uses the highest high or lowest low over a specified period.
- Standard Deviation: SL calculated using standard deviation.
Exit Conditions:
- If exit_after_close is enabled, the position will only close after the candle confirms the stop-loss hit.
- If exit_after_close is disabled, the strategy will close the trade immediately when the SL is breached.
Visualization:
The script plots the chosen trailing stop-loss method on the chart for easy visualization.
Target-Based Trailing SL Logic:
- When a position is opened, the strategy calculates the initial stop-loss and progressively adjusts it as the price moves favorably.
- Each SL adjustment is stored in an array for accurate tracking and visualization.
Alerts and Labels:
- When the Entry or trailing stop loss is hit this scripts draws a label and give alert to the user that trailing stop has been hit for the trade.
Note - on the historical data The Script will show nothing if the entry and the exit has happened on the same candle, because we don't know what was hit first SL or TP (basically how the candle was formed on the lower timeframe).
Summary:
This script offers flexible trailing stop-loss options for traders who want dynamic risk management in their strategies. By offering multiple methods like ATR, SAR, Supertrend, and EMA, it caters to various trading styles and risk preferences.

[blackcat] L3 Bullish Grab SignalOVERVIEW
The " L3 Bullish Grab Signal" indicator is designed to identify bullish trends and potential buying opportunities in the market. It uses a combination of moving averages and custom calculations to generate signals. The indicator is set to not overlay on the price chart, meaning it will have its own panel below the main chart, and it updates based on the specified timeframe.
FEATURES
Input Parameters:
shortEmaPeriod: Default value is 13, used for the shorter-term EMA.
longEmaPeriod: Default value is 34, used for the longer-term EMA.
signalEmaPeriod: Default value is 5, used to smooth the difference between the short and long EMAs.
lookbackPeriod: Default value is 60, used to look back over a certain number of bars for specific calculations.
Variable Calculations:
priceWeightedAverage: Calculated as (close * 2 + high + low) / 4 * 10, a custom price point.
shortEma: EMA of priceWeightedAverage over the short period.
longEma: EMA of priceWeightedAverage over the long period.
signalEma: EMA of the difference between shortEma and longEma, smoothed over the signalEmaPeriod.
oscillatorValue: Calculated as 2 * (shortEma - longEma - signalEma) * 5.5, a custom oscillator.
positiveOscillatorValue: Positive part of oscillatorValue, setting negative values to zero.
bullishSignal: True when positiveOscillatorValue increases and was previously negative.
confirmedBullishSignal: True when the bullish signal is confirmed by certain conditions involving the oscillator values and price increases.
priceIncreaseThreshold: Checks if the close price increased by more than 7% from the previous bar.
strongBullishSignal: Combines the bullish signal with the confirmed signal and the price increase threshold.
confirmedStrongBullishSignal: When all conditions for a strong bullish signal are met.
weakBullishSignal: Bullish signal that doesn't meet the strong criteria but still shows some strength.
Plotting:
Oscillator Value: Plots the raw oscillator value in white.
Positive Oscillator Value: Plots only the positive part of the oscillator value in white.
Strong Bullish Signal Stick: Plots a red candlestick when a strong bullish signal is confirmed, using the highest positive oscillator value over the lookback period.
Bullish Signal Stick: Plots a white candlestick for a bullish signal that isn't necessarily strong.
Weak Bullish Signal Stick: Plots a green candlestick for a weak bullish signal.
Positive Trend: Plots yellow candlesticks when the oscillator value is positive.
Negative Trend: Plots fuchsia candlesticks when the oscillator value is negative.
Numbers on Candles: Represents the breakout strength as a percentage change in price.
HOW TO USE
Install the Script: Add the script to your TradingView chart.
Customize Inputs:
Adjust the shortEmaPeriod, longEmaPeriod, signalEmaPeriod, and lookbackPeriod as needed.
Interpret the Charts:
Red Candles: Indicate a strong bullish trend, suggesting a potential buying opportunity.
White Candles: Indicate bullish signals that are not as strong but still suggest a buying opportunity.
Green Candles: Indicate weak bullish signals, suggesting a possible buying opportunity but with less confidence.
Yellow Candles: Indicate a positive trend, suggesting the market is in an uptrend.
Fuchsia Candles: Indicate a negative trend, suggesting the market is in a downtrend.
Numbers on Candles: Show the breakout strength as a percentage change in price.
Analyze Trends and Signals:
Use red candles to identify strong bullish signals, especially if the price has increased by more than 7% from the previous bar.
Monitor white and green candles for potential entries with lower confidence.
Avoid trading during fuchsia candles, as the market is in a downtrend.
MARKET MEANING AND TRADING USAGE
Strong Bullish Signal (Red Candles): Indicates a significant price increase and momentum, suggesting a strong buying opportunity.
Bullish Signal (White Candles): Suggests a buying opportunity but with less confidence compared to strong signals.
Weak Bullish Signal (Green Candles): Indicates a possible buying opportunity with even lower confidence.
Positive Trend (Yellow Candles): Suggests the market is in an uptrend.
Negative Trend (Fuchsia Candles): Suggests the market is in a downtrend.
Trading Strategy:
Buy: When a strong bullish signal is confirmed (red candle), especially if the price has increased by more than 7% from the previous bar.
Monitor: Watch for bullish signals (white candles) and weak bullish signals (green candles) for potential entries with lower confidence.
Avoid: During negative trends (fuchsia candles), as the market is in a downtrend.
LIMITATIONS
Simplicity: The implementation is based on a combination of moving averages and custom calculations, which might not capture all aspects of market dynamics.
Close Price Dependency: Uses close prices to determine trends and signals, which might not reflect intrabar price movements and trade imbalances accurately.
Historical Data: The script is based on historical data and does not guarantee future performance.
NOTES
Educational Tool: The script is designed for educational purposes and should not be considered financial advice.
Backtesting: Users are encouraged to backtest the strategy on a demo account before applying it to live trades.
Complementary Use: Best used in conjunction with other indicators and analysis methods for more accurate trading decisions.
THANKS
Special thanks to the TradingView community for their support and feedback.

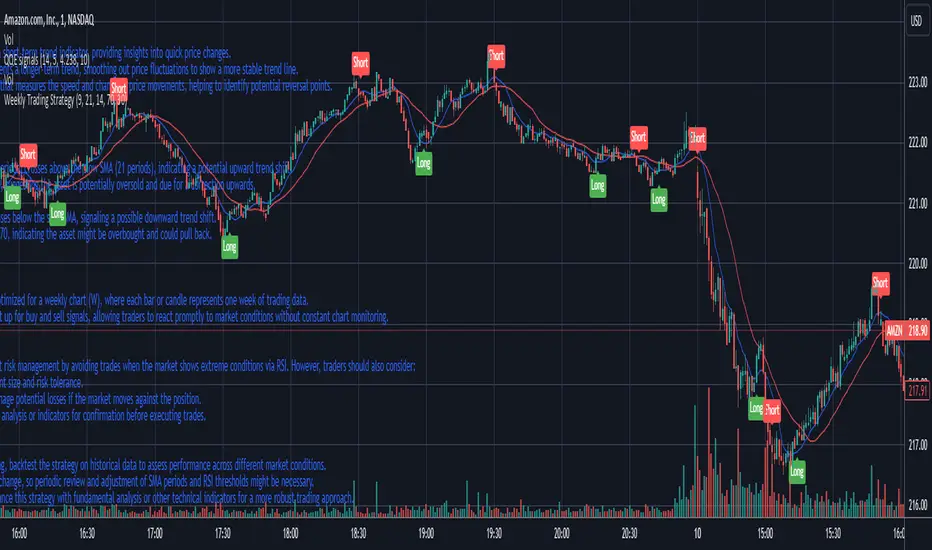
Weekly Trading StrategyStrategy Overview:
This trading strategy is designed for short-term trades over weekly intervals, utilizing the combination of Simple Moving Averages (SMA) for trend identification and the Relative Strength Index (RSI) for overbought/oversold conditions. It aims to capitalize on momentum shifts while mitigating the risk of entering a market at extreme points.
Key Components:
Fast SMA (9 periods): Acts as a short-term trend indicator, providing insights into quick price changes.
Slow SMA (21 periods): Represents a longer-term trend, smoothing out price fluctuations to show a more stable trend line.
RSI (14 periods): An oscillator that measures the speed and change of price movements, helping to identify potential reversal points.
Entry Signals:
Buy Signal:
Condition 1: The fast SMA (9 periods) crosses above the slow SMA (21 periods), indicating a potential upward trend shift.
Condition 2: RSI falls below 30, suggesting the asset is potentially oversold and due for a correction upwards.
Sell Signal:
Condition 1: The fast SMA crosses below the slow SMA, signaling a possible downward trend shift.
Condition 2: RSI climbs above 70, indicating the asset might be overbought and could pull back.
Strategy Execution:
Timeframe: This strategy is optimized for a weekly chart (W), where each bar or candle represents one week of trading data.
Alert System: Alerts can be set up for buy and sell signals, allowing traders to react promptly to market conditions without constant chart monitoring.
Risk Management:
This strategy includes inherent risk management by avoiding trades when the market shows extreme conditions via RSI. However, traders should also consider:
Position sizing based on account size and risk tolerance.
Setting stop-loss orders to manage potential losses if the market moves against the position.
Considering additional market analysis or indicators for confirmation before executing trades.
Considerations:
Backtesting: Before live trading, backtest the strategy on historical data to assess performance across different market conditions.
Adaptation: Market dynamics change, so periodic review and adjustment of SMA periods and RSI thresholds might be necessary.
Complementary Analysis: Enhance this strategy with fundamental analysis or other technical indicators for a more robust trading approach.
This strategy is suited for traders looking for weekly swings in the market, balancing between following the trend and spotting potential reversals. However, like all trading strategies, it should not be used in isolation but as part of a broader trading plan.
Enhanced VIP-like IndicatorSettings Breakdown Tutorial: Optimizing a Trading Strategy
This guide explains the key trading strategy settings and how to customize them based on your trading style and goals. Each parameter is essential for tailoring the strategy to market conditions and your risk appetite.
1. Short Moving Average Length (Default: 9)
• Purpose: Tracks short-term trends using a small number of candles.
• Settings Tips:
• Smaller Values (e.g., 9): Quickly react to price changes, useful for fast-moving markets.
• Larger Values (e.g., 12-15): Generate smoother signals for less volatile trades.
2. Long Moving Average Length (Default: 21)
• Purpose: Identifies long-term trends.
• Settings Tips:
• Higher Values (e.g., 50): Spot broader trends at the expense of slower signals.
• Trend Analysis: The interaction of short and long MAs helps determine bullish or bearish trends (e.g., bullish when short MA crosses above long MA).
3. Higher Timeframe MA Length (Default: 200)
• Purpose: Filters long-term trends on a higher timeframe (e.g., daily).
• Settings Tips:
• 200 Periods: Standard for defining bullish (price above) or bearish (price below) markets.
• Adjustable: Use 100 for faster responses or stick with 200 for reliability.
4. Higher Timeframe (Default: 1 Day)
• Purpose: Defines the timeframe for the higher moving average.
• Settings Tips:
• Shorter Timeframes (e.g., 4 Hours): More frequent trading signals.
• Daily Timeframe: Best for swing trading and identifying macro trends.
5. RSI Length (Default: 14)
• Purpose: Measures momentum over a specific number of candles.
• Settings Tips:
• Lower Values (e.g., 7): More sensitive to price changes, ideal for quick trades.
• Higher Values (e.g., 20): Smooth signals for more stable markets.
6. RSI Overbought (70) and Oversold (30) Levels
• Purpose: Marks thresholds for overbought and oversold conditions.
• Settings Tips:
• Stricter Levels (e.g., 80/20): Fewer, higher-quality signals.
• Looser Levels (e.g., 65/35): More frequent signals, suitable for active trading.
7. Pivot Left Bars (5) and Pivot Right Bars (5)
• Purpose: Confirms pivot points (support/resistance) based on surrounding candles.
• Settings Tips:
• Higher Values (e.g., 10): Stronger but less frequent pivot points.
• Lower Values: More responsive, for traders seeking quick pivots.
8. Take Profit Percentage (Default: 2%)
• Purpose: Defines the profit level to exit trades.
• Settings Tips:
• Higher Values (e.g., 5%): For swing traders holding positions longer.
• Lower Values (e.g., 1%): For scalpers focusing on quick trades.
9. Minimum Volume (Default: 1,000,000)
• Purpose: Ensures sufficient liquidity for trading.
• Settings Tips:
• Lower Values: For lower-volume markets.
• Higher Values: Reduces risk in high-liquidity assets.
10. Stop Loss Percentage (Default: 1%)
• Purpose: Sets the maximum acceptable loss per trade.
• Settings Tips:
• Lower Values (e.g., 0.5%): Reduces risk, suited for conservative trading.
• Higher Values (e.g., 2%): Allows more price fluctuation, ideal for volatile markets.
11. Entry Conditions
• Options:
• MA Crossover & RSI: Combines trend-following and momentum for well-rounded signals.
• Pivot Breakout: Focuses on support/resistance breakouts for high-impact trades.
• Settings Tips:
• Trend-Following Traders: Use MA Crossover & RSI.
12. Exit Conditions
• Options:
• Opposite Signal: Exits when the trade’s opposite condition occurs (e.g., bullish to bearish).
• Fixed Take Profit/Stop Loss: Exits based on predefined profit/loss thresholds.
• Settings Tips:
• Opposite Signal: Ideal for trend-following strategies.
Summary
Customizing these settings aligns the strategy with your trading goals. Test configurations in a demo environment before live trading to refine the approach and optimize results. Always balance profit potential with risk management.
• Fixed Levels: Better for strict risk management.
• Breakout Traders: Opt for Pivot Breakout.

Autonomous 5-Minute RobotKey Components of the Strategy:
Trend Detection:
A 50-period simple moving average (SMA) is used to define the market trend. If the current close is above the SMA, the market is considered to be in an uptrend (bullish), and if it's below, it's considered a downtrend (bearish).
The strategy also looks at the trend over the last 30 minutes (6 candles in a 5-minute chart). The strategy compares the previous close with the current close to detect an uptrend or downtrend.
Volume Analysis:
The strategy calculates buyVolume and sellVolume based on price movement within each candle.
The condition for entering a long position is when the market is in an uptrend, and the buy volume is greater than the sell volume.
The condition for entering a short position is when the market is in a downtrend, and the sell volume is greater than the buy volume.
Trade Execution:
The strategy enters a long position when the trend is up and the buy volume is higher than the sell volume.
The strategy enters a short position when the trend is down and the sell volume is higher than the buy volume.
Positions are closed based on stop-loss and take-profit conditions.
Stop-loss is set at 3% below the entry price.
Take-profit is set at 29% above the entry price.
Exit Conditions:
Long trades will be closed if the price falls 3% below the entry price or rises 29% above the entry price.
Short trades will be closed if the price rises 3% above the entry price or falls 29% below the entry price.
Visuals:
The SMA (50-period) is plotted on the chart to show the trend.
Buy and sell signals are marked with labels on the chart for easy identification.
With this being said this algo is still being worked on to be autonomous
Analyze the Market Direction: Determine whether the market is in an uptrend or downtrend over the past 30 minutes (using the last 6 candles in a 5-minute chart).
Use Trend Indicators and Volume: Implement trend-following indicators like moving averages or the SMA/EMA crossover and consider volume to decide when to enter or exit a trade.
Enter and Exit Trades: The robot will enter long positions when the trend is up and short positions when the trend is down. Additionally, it will close positions based on volume signals and price action (e.g., volume spikes, price reversals).

[blackcat] L3 Top and Bottom Divine JudgmentOVERVIEW
The "Top and Bottom Divine Judgment" indicator is designed to identify potential tops and bottoms in the market using a combination of EMAs, SMAs, and custom calculations based on high and low prices. It provides multiple lines and plots to help traders visualize different market conditions and potential turning points.
FEATURES
Customizable EMA and SMA periods for various calculations.
Identification of bullish and bearish trends using EMAs.
Detection of overbought and oversold conditions.
Multiple lines and histograms to indicate specific market conditions and potential reversals.
Visual alerts with colored lines and shapes.
HOW TO USE
Add the script to your TradingView chart.
Customize Settings:
Adjust the short_ema_period, long_ema_period, sma_period, high_period, low_period, and other period inputs in the "Inputs" section.
Bullish and Bearish EMAs:
bullish_ema (yellow) and bearish_ema (fuchsia) are plotted to assess the overall market trend.
When bullish_ema is above bearish_ema, it suggests an uptrend.
When bullish_ema is below bearish_ema, it suggests a downtrend.
High-Low Boundary Line:
A horizontal line at 50 (yellow) represents a midpoint in the normalized price range, helping to identify overbought or oversold conditions.
Danger and Caution, Sell Signal, etc.:
These lines indicate specific conditions where the market might be overextended or due for a reversal.
Histograms for CZS1 and CZS4:
These histograms (aqua and purple) represent changes in certain indicators, possibly related to momentum or volatility, helping traders gauge the strength of trends.
Support Line Cross:
A shape ("●") is plotted when the close price crosses above a calculated support line, which could be a buy signal.
Generate Trading Signals:
Bullish and Bearish Trends:
Use the crossover of bullish_ema and bearish_ema to identify potential trend changes.
Overbought/Oversold Conditions:
Use the High-Low Boundary Line to identify overbought or oversold levels.
Specific Market Conditions:
Use the lines for "Danger and Caution," "Sell Signal," "Weak Out Strong Stay," "Opportunity," "Low Suck," and "High Sell" to identify specific market conditions and potential reversals.
Support Line Cross:
Use the plotted shape to identify potential buy signals when the close price crosses above the support line.
Risk Management:
Use the indicator in conjunction with other tools and risk management strategies to confirm trading signals and manage positions effectively.
LIMITATIONS
The script is based on historical data and does not guarantee future performance.
It is recommended to use the script in conjunction with other analysis tools.
The effectiveness of the strategy may vary depending on the market conditions and asset being traded.
NOTES
The script is designed for educational purposes and should not be considered financial advice.
Users are encouraged to backtest the strategy on a demo account before applying it to live trades.
THANKS
Special thanks to the TradingView community for their support and feedback.

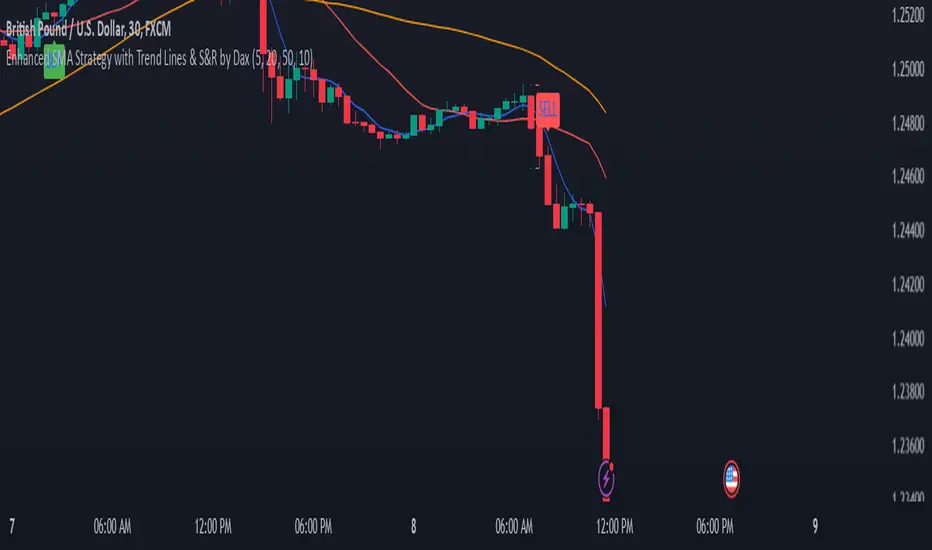
Enhanced SMA Strategy with Trend Lines & S&R by DaxThe Enhanced SMA Strategy with Trend Lines & Support/Resistance (S&R) by Dax indicator is a technical analysis tool designed to improve trading decisions by combining the simplicity of the Simple Moving Average (SMA) with the insight provided by trend lines and support/resistance levels. This hybrid approach aims to create a more robust and reliable trading strategy.
Key Components:
Simple Moving Average (SMA):
SMA is a basic trend-following indicator that calculates the average of a set of price data over a specified period. It helps identify the direction of the market, such as whether an asset is in an uptrend or downtrend.
The Enhanced SMA Strategy may use multiple SMAs, such as short-term (e.g., 20-period) and long-term (e.g., 50-period), to detect crossovers that signal buy or sell opportunities. For example, a bullish crossover occurs when a short-term SMA crosses above a long-term SMA, indicating a potential buying signal, while a bearish crossover signals a potential sell.
Trend Lines:
Trend lines are drawn on the price chart to visually identify the direction of the market, acting as dynamic support and resistance levels. A trend line is drawn by connecting two or more price points that demonstrate the overall price movement.
Trend lines can help traders see potential breakout or breakdown points. A price breaking above a downtrend line or below an uptrend line often signals a trend reversal.
Support and Resistance (S&R):
Support levels are price levels where an asset tends to find buying interest and stop falling, while Resistance levels are points where selling pressure emerges and prevent the price from rising further.
These levels are critical in determining where price reversals or consolidations are likely to occur. Enhanced S&R indicators can automatically identify these levels and draw horizontal lines at these critical points on the chart.
Combining S&R with SMA can help traders decide whether a breakout or bounce is likely at these levels, increasing the odds of a successful trade.
How It Works:
Trend Identification: The SMA is used to determine the trend direction. A rising SMA indicates an uptrend, while a falling SMA suggests a downtrend.
Signal Generation: The strategy often uses a combination of SMA crossovers (bullish or bearish) along with the confirmation of price action near trend lines and support/resistance levels. For example:
If a price breaks above resistance and the short-term SMA crosses above the long-term SMA, a buy signal is confirmed.
Conversely, if the price breaks below support and the short-term SMA crosses below the long-term SMA, a sell signal is given.
Dynamic Support/Resistance: Trend lines are drawn automatically or manually to spot areas where price might reverse. The Enhanced SMA Strategy checks if the price is close to these levels, providing a more precise entry/exit point based on the broader market context.
Advantages of the Enhanced SMA Strategy with Trend Lines & S&R:
Improved Accuracy: By combining trend-following (SMA) with key levels like trend lines and S&R, the strategy filters out false signals, leading to more reliable trade setups.
Trend Confirmation: The use of trend lines and S&R confirms the broader market context, reducing the risk of trading against the trend or entering at weak price points.
Flexible: This strategy can be applied to various timeframes, from short-term day trading to longer-term swing trading.
Visual Clarity: The combination of trend lines, S&R, and moving averages provides a clear and visually intuitive strategy for identifying key price levels and trend shifts.
How to Use It:
Draw Trend Lines: Identify the most recent price peaks and troughs to draw trend lines, marking the potential resistance and support levels.
Use SMAs: Apply two different-period SMAs to detect the trend (e.g., 20-period and 50-period). Pay attention to crossovers for buy/sell signals.
Watch for Breakouts or Reversals: Monitor how the price behaves at support or resistance levels and the trend lines. A price move beyond these levels, accompanied by a confirming SMA crossover, can signal a strong trade opportunity.
Conclusion:
The Enhanced SMA Strategy with Trend Lines & S&R by Dax is a powerful, multi-layered approach to technical analysis. It enhances the basic SMA strategy by incorporating additional tools like trend lines and support/resistance levels, which help traders make more informed decisions with higher accuracy. This method is suitable for both novice and experienced traders, offering clear trade signals while reducing the risk of false entries.
Hull Suite by MRS**Hull Suite by MRS Strategy Indicator**
The Hull Suite by MRS Strategy is a technical analysis tool designed to provide insights into market trends using variations of the Hull Moving Average (HMA). This strategy aims to help traders identify optimal entry points for both long and short positions by utilizing multiple types of Hull-based indicators.
### Key Features:
1. **Hull Moving Average Variations**: The indicator offers three different Hull Moving Average variants:
- **HMA (Hull Moving Average)**: A fast-moving average that minimizes lag and reacts quickly to price changes.
- **EHMA (Enhanced Hull Moving Average)**: A smoother version of HMA with reduced noise, offering a clearer view of market trends.
- **THMA (Triple Hull Moving Average)**: A more complex Hull average that aims to provide a stronger confirmation of trend direction.
2. **Customizable Parameters**:
- **Source Selection**: Allows traders to choose the source for calculation (e.g., closing prices).
- **Length**: A configurable parameter to adjust the period over which the moving average is calculated (e.g., 55-period for swing entries).
- **Trend Coloring**: Users can enable automatic color-coding of the Hull moving average to reflect whether the market is in an uptrend (green) or downtrend (red).
- **Candle Color**: Option to color candles based on Hull's trend, further improving the visual clarity of trend direction.
3. **Entry and Exit Signals**:
- **Buy Signal**: Generated when the Hull moving average crosses above its historical value, indicating a potential upward price movement.
- **Sell Signal**: Triggered when the Hull moving average crosses below its historical value, signaling a potential downward price movement.
- The strategy can be customized to work with long, short, or both directions, making it adaptable for various market conditions.
4. **Visual Representation**:
- **Hull Bands**: The indicator can plot the Hull moving average as bands, with customizable transparency to suit individual preferences.
- **Band Filler**: The area between the two Hull moving averages is filled, making it easier to identify trends at a glance.
5. **Backtesting and Strategy Execution**: This strategy can be tested on historical data with adjustable backtest start and stop dates, providing traders with a better understanding of its performance before live trading.
### Purpose:
The Hull Suite by MRS Strategy is designed to assist traders in determining the optimal time to enter and exit the market based on robust Hull moving averages. With its flexibility, it can be used for trend-following, swing trading, or other strategic applications.

Forex Pair Yield Momentum This Pine Script strategy leverages yield differentials between the 2-year government bond yields of two countries to trade Forex pairs. Yield spreads are widely regarded as a fundamental driver of currency movements, as highlighted by international finance theories like the Interest Rate Parity (IRP), which suggests that currencies with higher yields tend to appreciate due to increased capital flows:
1. Dynamic Yield Spread Calculation:
• The strategy dynamically calculates the yield spread (yield_a - yield_b) for the chosen Forex pair.
• Example: For GBP/USD, the spread equals US 2Y Yield - UK 2Y Yield.
2. Momentum Analysis via Bollinger Bands:
• Yield momentum is computed as the difference between the current spread and its moving
Bollinger Bands are applied to identify extreme deviations:
• Long Entry: When momentum crosses below the lower band.
• Short Entry: When momentum crosses above the upper band.
3. Reversal Logic:
• An optional checkbox reverses the trading logic, allowing long trades at the upper band and short trades at the lower band, accommodating different market conditions.
4. Trade Management:
• Positions are held for a predefined number of bars (hold_periods), and each trade uses a fixed contract size of 100 with a starting capital of $20,000.
Theoretical Basis:
1. Yield Differentials and Currency Movements:
• Empirical studies, such as Clarida et al. (2009), confirm that interest rate differentials significantly impact exchange rate dynamics, especially in carry trade strategies .
• Higher-yields tend to appreciate against lower-yielding currencies due to speculative flows and demand for higher returns.
2. Bollinger Bands for Momentum:
• Bollinger Bands effectively capture deviations in yield momentum, identifying opportunities where price returns to equilibrium (mean reversion) or extends in trend-following scenarios (momentum breakout).
• As Bollinger (2001) emphasized, this tool adapts to market volatility by dynamically adjusting thresholds .
References:
1. Dornbusch, R. (1976). Expectations and Exchange Rate Dynamics. Journal of Political Economy.
2. Obstfeld, M., & Rogoff, K. (1996). Foundations of International Macroeconomics.
3. Clarida, R., Davis, J., & Pedersen, N. (2009). Currency Carry Trade Regimes. NBER.
4. Bollinger, J. (2001). Bollinger on Bollinger Bands.
5. Mendelsohn, L. B. (2006). Forex Trading Using Intermarket Analysis.

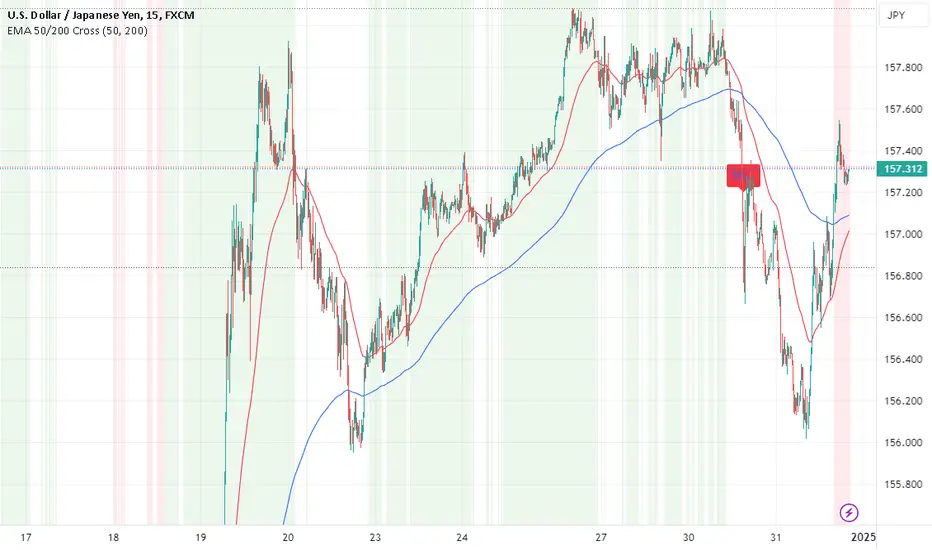
EMA Crossover Strategy with 50 & 200 EMAs - Faisal AnwarThis indicator uses 50 and 200-day Exponential Moving Averages (EMAs) to identify significant trend directions and potential trading opportunities through golden crossovers and death crosses. It highlights the role of EMAs as dynamic support in uptrends and downtrends, enhancing trend-following strategies.
Detailed Explanation:
EMAs Used:
The strategy utilizes two key EMAs — the 50-day EMA and the 200-day EMA. The 50-day EMA is often seen as a medium-term trend indicator, while the 200-day EMA is regarded as a benchmark for the long-term market trend.
Golden Crossover:
This occurs when the 50-day EMA crosses above the 200-day EMA, traditionally considered a bullish signal indicating potential long positions.
Death Cross:
This event is marked by the 50-day EMA crossing below the 200-day EMA, typically viewed as a bearish signal suggesting potential short positions.
Trend Support Identification:
The script also identifies when the price is above the 50-day EMA during an uptrend (indicating ongoing support) and when the price is above the 200-day EMA during a downtrend, suggesting the EMA is acting as resistance turning into support.
Visual Tools:
The indicator plots these EMAs on the chart with distinct colors for easy differentiation and uses background color changes to visually indicate when these EMAs act as support. Buy and sell signals are clearly marked with shapes and text directly on the chart for actionable insights.
Usage Tips:
Trading Decisions:
This indicator is best used in markets with clear trends, where EMAs can effectively identify shifts in momentum and serve as reliable support or resistance levels.
Complementary Tools:
Consider combining this EMA strategy with other technical analysis tools like RSI or MACD for confirmation of signals to enhance the reliability of the trading signals.
Ideal for:
Traders looking for a visual tool to assist in identifying trend directions and optimal points for entering or exiting trades based on established technical analysis principles.
Buy & Hold aka. HODL StrategyThis is a simply HODL or Buy & Hold strategy, which is super useful to see the risk and reward of such a strategy.
The benefit of using this strategy is that you also get to see the Max Drawdown (Risk).
This way you can compare it to the Net Profit (Reward) and decide if it's worth it for you.
This strategy buys on the Start Date and sells either on the End Date or on the last candle if the End Date is in the future.
Remember that the strategy must close the trade (sell) otherwise you don't see any results in the Strategy Tester (this is how it works).

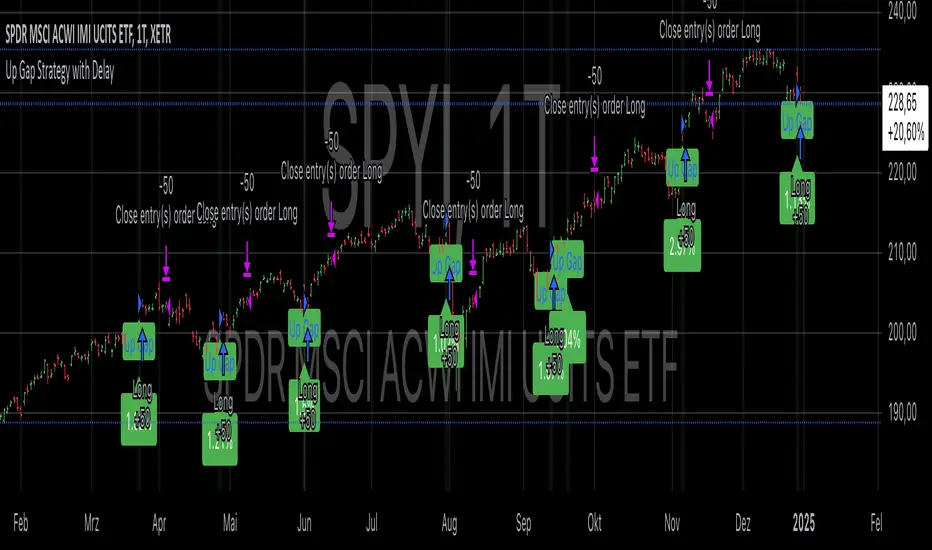
Up Gap Strategy with DelayThis strategy, titled “Up Gap Strategy with Delay,” is based on identifying up gaps in the price action of an asset. A gap is defined as the percentage difference between the current bar’s open price and the previous bar’s close price. The strategy triggers a long position if the gap exceeds a user-defined threshold and includes a delay period before entering the position. After entering, the position is held for a set number of periods before being closed.
Key Features:
1. Gap Threshold: The strategy defines an up gap when the gap size exceeds a specified threshold (in percentage terms). The gap threshold is an input parameter that allows customization based on the user’s preference.
2. Delay Period: After the gap occurs, the strategy waits for a delay period before initiating a long position. This delay can help mitigate any short-term volatility that might occur immediately after the gap.
3. Holding Period: Once the position is entered, it is held for a user-defined number of periods (holdingPeriods). This is to capture the potential post-gap trend continuation, as gaps often indicate strong directional momentum.
4. Gap Plotting: The strategy visually plots up gaps on the chart by placing a green label beneath the bar where the gap condition is met. Additionally, the background color turns green to highlight up-gap occurrences.
5. Exit Condition: The position is exited after the defined holding period. The strategy ensures that the position is closed after this time, regardless of whether the price is in profit or loss.
Scientific Background:
The gap theory has been widely studied in financial literature and is based on the premise that gaps in price often represent areas of significant support or resistance. According to research by Kaufman (2002), gaps in price action can be indicators of future price direction, particularly when they occur after a period of consolidation or a trend reversal. Moreover, Gaps and their Implications in Technical Analysis (Murphy, 1999) highlights that gaps can reflect imbalances between supply and demand, leading to high momentum and potential price continuation or reversal.
In trading strategies, utilizing gaps with specific conditions, such as delay and holding periods, can enhance the ability to capture significant price moves. The strategy’s delay period helps avoid potential market noise immediately after the gap, while the holding period seeks to capitalize on the price continuation that often follows gap formation.
This methodology aligns with momentum-based strategies, which rely on the persistence of trends in financial markets. Several studies, including Jegadeesh & Titman (1993), have documented the existence of momentum effects in stock prices, where past price movements can be predictive of future returns.
Conclusion:
This strategy incorporates gap detection and momentum principles, supported by empirical research in technical analysis, to attempt to capitalize on price movements following significant gaps. By waiting for a delay period and holding the position for a specified time, it aims to mitigate the risk associated with early volatility while maximizing the potential for sustained price moves.
IU 4 Bar UP StrategyIU 4 Bar UP Strategy
The IU 4 Bar UP Strategy is a trend-following strategy designed to identify and execute long trades during strong bullish momentum, combined with confirmation from the SuperTrend indicator. This strategy is suitable for traders aiming to capitalize on sustained upward market movements.
Features :
1. SuperTrend Confirmation: Incorporates the SuperTrend indicator as a dynamic support/resistance line to filter trades in the direction of the trend.
2. 4 Consecutive Bullish Bars: Detects a series of 4 bullish candles as a signal for strong upward momentum, ensuring robust trade setups.
3. Dynamic Alerts: Sends alerts for trade entries and exits to keep traders informed.
4. Visual Enhancements:
- Plots the SuperTrend indicator on the chart.
- Changes the background color while a trade is active for easy visualization.
Inputs :
- SuperTrend ATR Period: The period used to calculate the Average True Range (ATR) for the SuperTrend indicator.
- SuperTrend ATR Factor: The multiplier for the ATR in the SuperTrend calculation.
Entry Conditions :
A long entry is triggered when:
1. The last 4 consecutive candles are bullish (closing prices are higher than opening prices).
2. The current price is above the SuperTrend line.
3. The strategy is not already in a position.
4. The bar is confirmed (not a partially formed bar).
When all these conditions are met, the strategy enters a long position and provides an alert:
"Long Entry triggered"
Exit Conditions :
The strategy exits the long position when:
1. The closing price drops below the SuperTrend line.
2. An alert is generated: "Close the long Trade"
Visualization :
- The SuperTrend line is plotted, dynamically colored:
- Green when the trend is bullish.
- Red when the trend is bearish.
- The background color turns semi-transparent green while a trade is active, indicating a long position.
Do use proper risk management while using this strategy.

MERCURY-PRO by DrAbhiramSivprasd“MERCURYPRO”
The MERCURYPRO indicator is a custom technical analysis tool designed to provide dynamic trend signals based on a combination of the Chande Momentum Oscillator (CMO) and Standard Deviation (StDev). This indicator helps traders identify trend reversals or continuation based on the behavior of the price and momentum.
Key Features:
• Source Input: The indicator works with any price data, with the default set to close, which represents the closing price of each bar.
• Length Input: A period (default value 9) is used to determine the calculation window for the Chande Momentum Oscillator and Standard Deviation.
• Fixed CMO Length Option: Users can choose whether to use a fixed CMO length of 9 or adjust the length to the user-defined pds value.
• Calculation Method: The indicator allows switching between using the Chande Momentum Oscillator (CMO) or Standard Deviation (StDev) for the momentum calculation.
• Alpha: The smoothing factor used in the calculation of the MERCURYPRO value, which is based on the length of the period input (pds).
Core Calculation:
1. Momentum Calculation: The script calculates the momentum by determining the change in the source price (e.g., close) from one period to the next.
2. Chande Momentum Oscillator (CMO): The positive and negative momentum components are calculated and then summed over the specified period. This value is normalized to a percentage to determine the momentum strength.
3. K Value Calculation: The script selects either the CMO or Standard Deviation (depending on the user setting) to calculate the k value, which represents the dynamic price momentum.
4. MERCURYPRO Line: The final output of the indicator, MERCURYPRO, is computed using a weighted average of the k value and the previous MERCURYPRO value. The line is smoothed using the Alpha parameter.
Plot and Signal Generation:
• Color Coding: The line is color-coded based on the direction of MERCURYPRO:
• Blue: The trend is bullish (MERCURYPRO is rising).
• Maroon: The trend is bearish (MERCURYPRO is falling).
• Default Blue: Neutral or sideways market conditions.
• Plotting: The MERCURYPRO line is plotted with varying colors depending on the trend direction.
Alerts:
• Color Change Alert: The indicator has an alert condition based on when the MERCURYPRO line crosses its previous value. This helps traders stay informed about potential trend reversals or continuation signals.
Use Case:
• Trend Confirmation: Traders can use the MERCURYPRO indicator to identify whether the market is in a strong trend or not.
• Signal for Entries/Exits: The color change and crossovers of the MERCURYPRO line can be used as entry or exit signals, depending on the trader’s strategy.
Overall Purpose:
The MERCURYPRO indicator combines momentum analysis with smoothing techniques to offer a dynamic, responsive tool for identifying market trends and potential reversals. It is particularly useful in conjunction with other technical indicators to provide confirmation for trade setups.
How to Use the MERCURYPRO Indicator:
The MERCURYPRO indicator is designed to help traders identify trend reversals and market conditions. Here are a few ways you can use it:
1. Trend Confirmation (Bullish or Bearish)
• Bullish Trend: When the MERCURYPRO line is colored Blue, it indicates a rising trend, suggesting that the market is bullish.
• Action: You can consider entering long positions when the line turns blue, or holding your existing positions if you’re already long.
• Bearish Trend: When the MERCURYPRO line is colored Maroon, it signals a downward trend, indicating a bearish market.
• Action: You may consider entering short positions or closing any long positions when the line turns maroon.
2. Trend Reversal Alerts
• Color Change: The MERCURYPRO indicator changes color when there’s a trend reversal. The alert condition triggers when the MERCURYPRO crosses above or below its previous value, signaling a potential shift in the trend.
• Action: You can use this alert as a signal to monitor potential entry or exit points for trades. For example, a crossover from maroon to blue could indicate a potential buying opportunity, while a crossover from blue to maroon could suggest a selling opportunity.
3. Use with Other Indicators for Confirmation
• While the MERCURYPRO provides valuable trend insights, it’s often more effective when used in combination with other indicators like RSI (Relative Strength Index), MACD, or moving averages to confirm signals.
• Example: If MERCURYPRO turns blue and RSI is above 50, it may signal a strong bullish trend, enhancing the confidence to enter a long trade.
4. Divergence
• Watch for divergence between the MERCURYPRO line and the price chart:
• Bullish Divergence: If the price makes new lows while MERCURYPRO is showing higher lows, it suggests a potential bullish reversal.
• Bearish Divergence: If the price makes new highs while MERCURYPRO is showing lower highs, it suggests a potential bearish reversal.
Example of Use:
• Example 1: If the MERCURYPRO line changes from maroon to blue, you might enter a long position. After the MERCURYPRO line turns blue, use an alert to monitor the price action. If other indicators (like RSI) also suggest strength, your confidence in the trade will increase.
• Example 2: If the MERCURYPRO line shifts from blue to maroon, it could be a signal to close long positions and consider shorting the market if other conditions align (e.g., moving averages also turn bearish).
Warning for Using the MERCURYPRO Indicator:
1. Lagging Indicator:
• The MERCURYPRO is a lagging indicator, meaning it responds to price changes after they have occurred. This may delay entry and exit signals, and it’s crucial to combine it with other leading indicators to get timely information.
2. False Signals in Range-bound Markets:
• In choppy or sideways markets, the MERCURYPRO line can produce false signals, flipping between blue and maroon frequently without showing a clear trend. It’s important to avoid trading based on these false signals when the market is not trending.
3. Overreliance on One Indicator:
• Relying solely on MERCURYPRO can be risky. Always confirm signals with additional tools like volume analysis, price action, or other indicators to increase the accuracy of your trades.
4. Market Conditions Matter:
• The indicator may work well in trending markets, but in highly volatile or news-driven environments, it may provide misleading signals. Ensure that you take market fundamentals and external news events into consideration before acting on the indicator’s signals.
5. Risk Management:
• As with any technical indicator, MERCURYPRO is not infallible. Always use appropriate risk management techniques such as stop-loss orders to protect your capital. Never risk more than you can afford to lose on a trade.
6. Backtest First:
• Before implementing MERCURYPRO in live trading, make sure to backtest it on historical data. Test the strategy with various market conditions to assess its effectiveness and identify any potential weaknesses.
By considering these guidelines and warnings, you can use the MERCURYPRO indicator more effectively and mitigate potential risks in your trading strategy.

Temporary Help Services Jobs - Trend Allocation StrategyThis strategy is designed to capitalize on the economic trends represented by the Temporary Help Services (TEMPHELPS) index, which is published by the Federal Reserve Economic Data (FRED). Temporary Help Services Jobs are often regarded as a leading indicator of labor market conditions, as changes in temporary employment levels frequently precede broader employment trends.
Methodology:
Data Source: The strategy uses the FRED dataset TEMPHELPS for monthly data on temporary help services.
Trend Definition:
Uptrend: When the current month's value is greater than the previous month's value.
Downtrend: When the current month's value is less than the previous month's value.
Entry Condition: A long position is opened when an uptrend is detected, provided no position is currently held.
Exit Condition: The long position is closed when a downtrend is detected.
Scientific Basis:
The TEMPHELPS index serves as a leading economic indicator, as noted in studies analyzing labor market cyclicality (e.g., Katz & Krueger, 1999). Temporary employment is often considered a proxy for broader economic conditions, particularly in predicting recessions or recoveries. Incorporating this index into trading strategies allows for aligning trades with potential macroeconomic shifts, as suggested by research on employment trends and market performance (Autor, 2001; Valetta & Bengali, 2013).
Usage:
This strategy is best suited for long-term investors or macroeconomic trend followers who wish to leverage labor market signals for equity or futures trading. It operates exclusively on end-of-month data, ensuring minimal transaction costs and noise.

Moving Average Crossover Strategy with Take Profit and Stop LossThe Moving Average Crossover Strategy is a popular trading technique that utilizes two moving averages (MAs) of different periods to identify potential buy and sell signals. By incorporating take profit and stop loss levels, traders can effectively manage their risk while maximizing potential returns. Here’s a detailed explanation of how this strategy works:
Overview of the Moving Average Crossover Strategy
Moving Averages:
A short-term moving average (e.g., 50-day MA) reacts more quickly to price changes, while a long-term moving average (e.g., 200-day MA) smooths out price fluctuations over a longer period.
The strategy generates trading signals based on the crossover of these two averages:
Buy Signal: When the short-term MA crosses above the long-term MA (often referred to as a "Golden Cross").
Sell Signal: When the short-term MA crosses below the long-term MA (known as a "Death Cross").
Implementing Take Profit and Stop Loss
1. Setting Take Profit Levels
Definition: A take profit order automatically closes a trade when it reaches a specified profit level.
Strategy:
Determine a realistic profit target based on historical price action, support and resistance levels, or a fixed risk-reward ratio (e.g., 2:1).
For instance, if you enter a buy position at $100, you might set a take profit at $110 if you anticipate that level will act as resistance.
2. Setting Stop Loss Levels
Definition: A stop loss order limits potential losses by closing a trade when the price reaches a specified level.
Strategy:
Place the stop loss just below the most recent swing low for buy orders or above the recent swing high for sell orders.
Alternatively, you can use a percentage-based method (e.g., 2-3% below the entry point) to define your stop loss.
For example, if you enter a buy position at $100 with a stop loss set at $95, your maximum loss would be limited to $5 per share.
Example of Using Moving Average Crossover with Take Profit and Stop Loss
Entry Signal:
You observe that the 50-day MA crosses above the 200-day MA at $100. You enter a buy position.
Setting Take Profit and Stop Loss:
You analyze historical price levels and set your take profit at $110.
You place your stop loss at $95 based on recent swing lows.
Trade Management:
If the price rises to $110, your take profit order is executed, securing your profit.
If the price falls to $95, your stop loss is triggered, limiting your losses.

IU open equal to high/low strategyIU open equal to high/low strategy:
The "IU Open Equal to High/Low Strategy" is designed to identify and trade specific market conditions where the day's first price action shows a strong directional bias. This strategy automatically enters trades based on the relationship between the market's open price and its first high or low of the day.
Entry Conditions:
1. Long Entry: A long position is initiated when the first open price of the session equals the day's first low. This signals a potential upward move.
2. Short Entry: A short position is initiated when the first open price of the session equals the day's first high. This signals a potential downward move.
Exit Conditions:
1. Stop Loss (SL): For both long and short trades, the stop loss is calculated based on the low or high of the candle where the position was entered.
2. Take Profit (TP): The take profit is set using a Risk-to-Reward (RTR) ratio, which is customizable by the user. The TP is calculated relative to the entry price and the distance between the entry and the stop loss.
Additional Features:
- Plots are used to visualize the entry price, stop loss, and take profit levels directly on the chart, providing clear and actionable insights.
- Labels are displayed to indicate the occurrence of the "Open == Low" or "Open == High" conditions for easier identification of potential trade setups.
- A dynamic fill highlights the areas between the entry price and the stop loss or take profit, offering a clear visual representation of the trade's risk and reward zones.
This strategy is designed for traders looking to capitalize on directional momentum at the start of the trading session. It is customizable, allowing users to set their desired Risk-to-Reward ratio and tailor the strategy to fit their trading style.

TearRepresentative's Rule-Based Dip Buying Strategy Rule-Based Dip Buying Strategy Indicator
This TradingView indicator, inspired by TearRepresentative [ , is a refined tool designed to assist traders in implementing a rule-based dip buying strategy. The indicator automates the identification of optimal buy and sell points, helping traders stay disciplined and minimize emotional biases. It is tailored to index trading, specifically leveraged ETFs like SPXL, to capture opportunities in market pullbacks and recoveries.
Key Features
Dynamic Buy Levels:
Tracks the local high over a customizable lookback period and calculates three buy levels based on percentage drops from the high:
Buy Level 1: First entry point (e.g., 15% drop).
Buy Level 2: Second entry point (e.g., additional 10% drop).
Buy Level 3: Third entry point (e.g., additional 7% drop).
Average Price Tracking:
Dynamically calculates the average price for entered positions when multiple buy levels are triggered.
Sell Level:
Computes a take-profit level (e.g., 20% above the average price) to automate profit-taking when the market rebounds.
Signal Visualization:
Buy Signals: Displayed as green triangles at each buy level.
Sell Signals: Displayed as red triangles at the sell level.
Alerts:
Configurable alerts notify traders when buy or sell signals are triggered, ensuring no opportunity is missed.
Visual Aids:
Semi-transparent and dynamic lines represent buy and sell levels for clear visualization.
Labels provide additional clarity for active levels, helping traders quickly identify actionable signals.
How It Works
The indicator analyzes market movements to identify dips based on predefined thresholds.
Buy signals are triggered when the market price reaches specified levels below the local high.
Once a position is taken, the indicator dynamically adjusts the average entry price and calculates the corresponding sell level.
A sell signal is generated when the market price rises above the calculated take-profit level.
Why Use This Indicator?
Discipline: Automates decision-making, removing emotional factors from trading.
Clarity: Provides clear entry and exit points to simplify complex market dynamics.
Versatility: Suitable for all market conditions, especially during pullbacks and rebounds.
Customization: Allows traders to tailor parameters to their preferred trading style and risk tolerance.
Acknowledgment
This indicator is based on the strategy and insights provided by TearRepresentative, whose expertise in rule-based trading has inspired countless traders. TearRepresentative's approach emphasizes simplicity, reliability, and consistency, offering a robust framework for long-term success.

MFS-3 Bars Pattern Strategy3 Bar Pattern Strategy
Detects an Ignite Candle followed by a Pullback Candle followed by a Confirmation Candle.
A Box will be drawn around the setup and three arrows will identify I, P, C (Ignite, Pullback, Confirmation) the setup.
The strategy will calculate a Stop Loss below the Low Price of the Ignite candle and a Take Profit at 2 times the Stop Loss giving a Risk to Reward Ratio of 1:2.
Extra conditions are included to reduce false triggers:
- A down trend must be detected using 3 SMA (Long, Medium, Short) that should be aligned from Long to Short one above the other.
- The Ignite Candle's body must be BELOW the Short SMA
An input form is available to adjust some strategy parameters.
Performance Note
----------------------
Trading conditions are very strict, so most of the time, no signals will be detected in the Strategy window.
This strategy should only be one of many strategies used for trade setups.
Hope you enjoy it.

R-based Strategy Template [Daveatt]Have you ever wondered how to properly track your trading performance based on risk rather than just profits?
This template solves that problem by implementing R-multiple tracking directly in TradingView's strategy tester.
This script is a tool that you must update with your own trading entry logic.
Quick notes
Before we dive in, I want to be clear: this is a template focused on R-multiple calculation and visualization.
I'm using a basic RSI strategy with dummy values just to demonstrate how the R tracking works. The actual trading signals aren't important here - you should replace them with your own strategy logic.
R multiple logic
Let's talk about what R-multiple means in practice.
Think of R as your initial risk per trade.
For instance, if you have a $10,000 account and you're risking 1% per trade, your 1R would be $100.
A trade that makes twice your risk would be +2R ($200), while hitting your stop loss would be -1R (-$100).
This way of measuring makes it much easier to evaluate your strategy's performance regardless of account size.
Whenever the SL is hit, we lose -1R
Proof showing the strategy tester whenever the SL is hit: i.imgur.com
The magic happens in how we calculate position sizes.
The script automatically determines the right position size to risk exactly your specified percentage on each trade.
This is done through a simple but powerful calculation:
risk_amount = (strategy.equity * (risk_per_trade_percent / 100))
sl_distance = math.abs(entry_price - sl_price)
position_size = risk_amount / (sl_distance * syminfo.pointvalue)
Limitations with lower timeframe gaps
This ensures that if your stop loss gets hit, you'll lose exactly the amount you intended to risk. No more, no less.
Well, could be more or less actually ... let's assume you're trading futures on a 15-minute chart but in the 1-minute chart there is a gap ... then your 15 minute SL won't get filled and you'll likely to not lose exactly -1R
This is annoying but it can't be fixed - and that's how trading works anyway.
Features
The template gives you flexibility in how you set your stop losses. You can use fixed points, ATR-based stops, percentage-based stops, or even tick-based stops.
Regardless of which method you choose, the position sizing will automatically adjust to maintain your desired risk per trade.
To help you track performance, I've added a comprehensive statistics table in the top right corner of your chart.
It shows you everything you need to know about your strategy's performance in terms of R-multiples: how many R you've won or lost, your win rate, average R per trade, and even your longest winning and losing streaks.
Happy trading!
And remember, measuring your performance in R-multiples is one of the most classical ways to evaluate and improve your trading strategies.
Daveatt

MCP Stop Strategy [JARUTIR]The MCP Stop Strategy is a trading tool designed to help traders lock in profits and manage risks. It is based on the concept of setting a MCP (Mental Capacity Preservation) Stop explained in the book "The Lifecycle Trade". I call it Maximum Controllable Profit Stop which helps protect profits once a stock or asset reaches a new peak. The MCP Stop is dynamically calculated based on the Buy Price and the All Time High Price (Peak Price), and is adjusted using a customizable percentage (MCP%) to retain a portion of the gains from the peak price during a drawdown.
Key Features :
MCP Stop Calculation: The script calculates the MCP Stop as:
MCP Stop = Buy Price + (Peak Price - Buy Price) x MCP%
This helps you protect a portion of your gains (defined by MCP%) as the price moves in your favor.
Flexible Buy Date Option:
You can either manually input a Buy Date or let the script automatically detect the Buy Date when the price first meets or exceeds the user-defined Buy Price.
After the Buy Date, the MCP Stop, Buy Price, and Peak Price are plotted on the chart for easy visualization.
Customizable Parameters:
Buy Price: The price at which the asset was bought.
MCP Percentage: The percentage of profit from the peak that you want to retain in case of a drawdown.
Lookback Length: The number of bars to consider when calculating the Peak Price (All Time High).
How to Use the Script :
Set the Buy Price: Enter the price at which you bought the asset.
Set the MCP%: Enter the percentage of profits you want to protect from the peak. For example, if you want to retain 10% of the gain from the peak, set this to 10.
Choose the Buy Date Method:
Automated Buy Date: The script will automatically detect the first bar where the price meets or exceeds the Buy Price.
Manual Buy Date: If you prefer to specify a particular Buy Date, input the desired date and time.
View the MCP Stop and Peak Price: After the Buy Date (either manually or automatically detected), the MCP Stop, Buy Price, and Peak Price will be plotted on the chart.
Monitor the MCP Stop Trigger: The script will alert you when the price falls below the MCP Stop, indicating a potential exit point to protect profits.
Frequently Asked Questions (FAQs):
1. What is the MCP Stop?
The MCP Stop is a dynamic stop-loss level that adjusts based on your Buy Price and the All Time High Price (Peak Price). It protects a portion of your gains from the peak, which is defined by the MCP%. For example, if you set the MCP% to 10%, the script will retain 10% of the gains from the peak and use this as a stop-loss.
2. How does the Buy Date work?
The Buy Date is the date when you entered the position:
If you choose Automated Buy Date, the script will automatically set the Buy Date to the first bar when the price meets or exceeds the Buy Price.
If you choose Manual Buy Date, you can specify a particular date and time when you want the strategy to start calculating and plotting the MCP Stop and Peak Price.
3. What happens if the price falls below the MCP Stop?
If the price drops below the MCP Stop, the script will mark this as a potential exit point, helping you protect profits. A visual alert (MCP STOP) will be shown on the chart when the price reaches or falls below the MCP Stop.
4. Can I adjust the Lookback Length for Peak Price?
Yes, you can customize the Lookback Length (the number of bars the script considers when calculating the Peak Price) by entering a value in the input field. By default, it is set to 1000 bars, which represents a few months of historical data, but you can increase or decrease this based on your trading strategy.
5. Why would I want to use the automated Buy Date?
The Automated Buy Date is useful for traders who want the script to automatically track the Buy Date when the price first reaches or exceeds the Buy Price. This is helpful when you're unsure of the exact entry date but know the price at which you bought the asset. It simplifies the process by eliminating the need for manual input.
6. Can I use this strategy for long and short positions?
The current version of this script is designed for long positions, where you buy an asset and want to protect your profits as the price increases. If you're interested in applying it to short positions, you would need to adjust the logic accordingly (e.g., tracking the lowest price instead of the peak price).
7. Can I modify the script to fit my trading strategy?
Yes, this script is highly customizable. You can adjust parameters such as Buy Price, MCP%, and Lookback Length to suit your specific trading style. You can also tweak the visual appearance of the plotted lines and alerts.
Disclaimer:
This strategy is intended for educational purposes only. It should not be considered financial advice. Always perform your own research and consult with a professional before making any trading decisions. Trading involves significant risk, and you should never trade with money you cannot afford to lose.

RSI and Bollinger Bands Screener [deepakks444]Indicator Overview
The indicator is designed to help traders identify potential long signals by combining the Relative Strength Index (RSI) and Bollinger Bands across multiple timeframes. This combination allows traders to leverage the strengths of both indicators to make more informed trading decisions.
Understanding RSI
What is RSI?
The Relative Strength Index (RSI) is a momentum oscillator that measures the speed and change of price movements. Developed by J. Welles Wilder Jr. for stocks and forex trading, the RSI is primarily used to identify overbought or oversold conditions in an asset.
How RSI Works:
Calculation: The RSI is calculated using the average gains and losses over a specified period, typically 14 periods.
Range: The RSI oscillates between 0 and 100.
Interpretation:
Key Features of RSI:
Momentum Indicator: RSI helps identify the momentum of price movements.
Divergences: RSI can show divergences, where the price makes a higher high, but the RSI makes a lower high, indicating potential reversals.
Trend Identification: RSI can also help identify trends. In an uptrend, the RSI tends to stay above 50, and in a downtrend, it tends to stay below 50.
Understanding Bollinger Bands
What is Bollinger Bands?
Bollinger Bands are a type of trading band or envelope plotted two standard deviations (positively and negatively) away from a simple moving average (SMA) of a price. Developed by financial analyst John Bollinger, Bollinger Bands consist of three lines:
Upper Band: SMA + (Standard Deviation × Multiplier)
Middle Band (Basis): SMA
Lower Band: SMA - (Standard Deviation × Multiplier)
How Bollinger Bands Work:
Volatility Measure: Bollinger Bands measure the volatility of the market. When the bands are wide, it indicates high volatility, and when the bands are narrow, it indicates low volatility.
Price Movement: The price tends to revert to the mean (middle band) after touching the upper or lower bands.
Support and Resistance: The upper and lower bands can act as dynamic support and resistance levels.
Key Features of Bollinger Bands:
Volatility Indicator: Bollinger Bands help traders understand the volatility of the market.
Mean Reversion: Prices tend to revert to the mean (middle band) after touching the bands.
Squeeze: A Bollinger Band Squeeze occurs when the bands narrow significantly, indicating low volatility and a potential breakout.
Combining RSI and Bollinger Bands
Strategy Overview:
The strategy aims to identify potential long signals by combining RSI and Bollinger Bands across multiple timeframes. The key conditions are:
RSI Crossing Above 60: The RSI should cross above 60 on the 15-minute timeframe.
RSI Above 60 on Higher Timeframes: The RSI should already be above 60 on the hourly and daily timeframes.
Price Above 20MA or Walking on Upper Bollinger Band: The price should be above the 20-period moving average of the Bollinger Bands or walking on the upper Bollinger Band.
Strategy Details:
RSI Calculation:
Calculate the RSI for the 15-minute, 1-hour, and 1-day timeframes.
Check if the RSI crosses above 60 on the 15-minute timeframe.
Ensure the RSI is above 60 on the 1-hour and 1-day timeframes.
Bollinger Bands Calculation:
Calculate the Bollinger Bands using a 20-period moving average and 2 standard deviations.
Check if the price is above the 20-period moving average or walking on the upper Bollinger Band.
Entry and Exit Signals:
Long Signal: When all the above conditions are met, consider a long entry.
Exit: Exit the trade when the price crosses below the 20-period moving average or the stop-loss is hit.
Example Usage
Setup:
Add the indicator to your TradingView chart.
Configure the inputs as per your requirements.
Monitoring:
Look for the long signal on the chart.
Ensure that the RSI is above 60 on the 15-minute, 1-hour, and 1-day timeframes.
Check that the price is above the 20-period moving average or walking on the upper Bollinger Band.
Trading:
Enter a long position when the criteria are met.
Set a stop-loss below the low of the recent 15-minute candle or based on your risk management rules.
Monitor the trade and exit when the RSI returns below 60 on any of the timeframes or when the price crosses below the 20-period moving average.
House Rules Compliance
No Financial Advice: This strategy is for educational purposes only and should not be construed as financial advice.
Risk Management: Always use proper risk management techniques, including stop-loss orders and position sizing.
Past Performance: Past performance is not indicative of future results. Always conduct your own research and analysis.
TradingView Guidelines: Ensure that any shared scripts or strategies comply with TradingView's terms of service and community guidelines.
Conclusion
This strategy combines RSI and Bollinger Bands across multiple timeframes to identify potential long signals. By ensuring that the RSI is above 60 on higher timeframes and that the price is above the 20-period moving average or walking on the upper Bollinger Band, traders can make more informed decisions. Always remember to conduct thorough research and use proper risk management techniques.
